Added 18/06/2025
Transportation
brotcorne2001
Datasets
Description
Figure 1 in A Bilevel Model for Toll Optimization on a Multicommodity Transportation Network.Dimension
{
  "x": 7,
  "y": 7,
  "F": 1,
  "G": 14,
  "H": 0,
  "f": 1,
  "g": 7,
  "h": 6
}
Solution
{
  "optimality": "global",
  "x": [0,0,0,0,5,0,-2],
  "y": [0,1,0,1,2,1,1],
  "F": -8,
  "f": 14
}Description
A toll on the central highway between the suppliers and demand.Dimension
{
  "x": 7,
  "y": 7,
  "F": 1,
  "G": 14,
  "H": 0,
  "f": 1,
  "g": 7,
  "h": 5
}
Solution
{
  "optimality": "global",
  "x": [0,0,0,0,0,0,100],
  "y": [0,1,0,1,1,0,1],
  "F": -100,
  "f": 440
}\subsection{brotcorne2001}
\label{subsec:brotcorne2001}
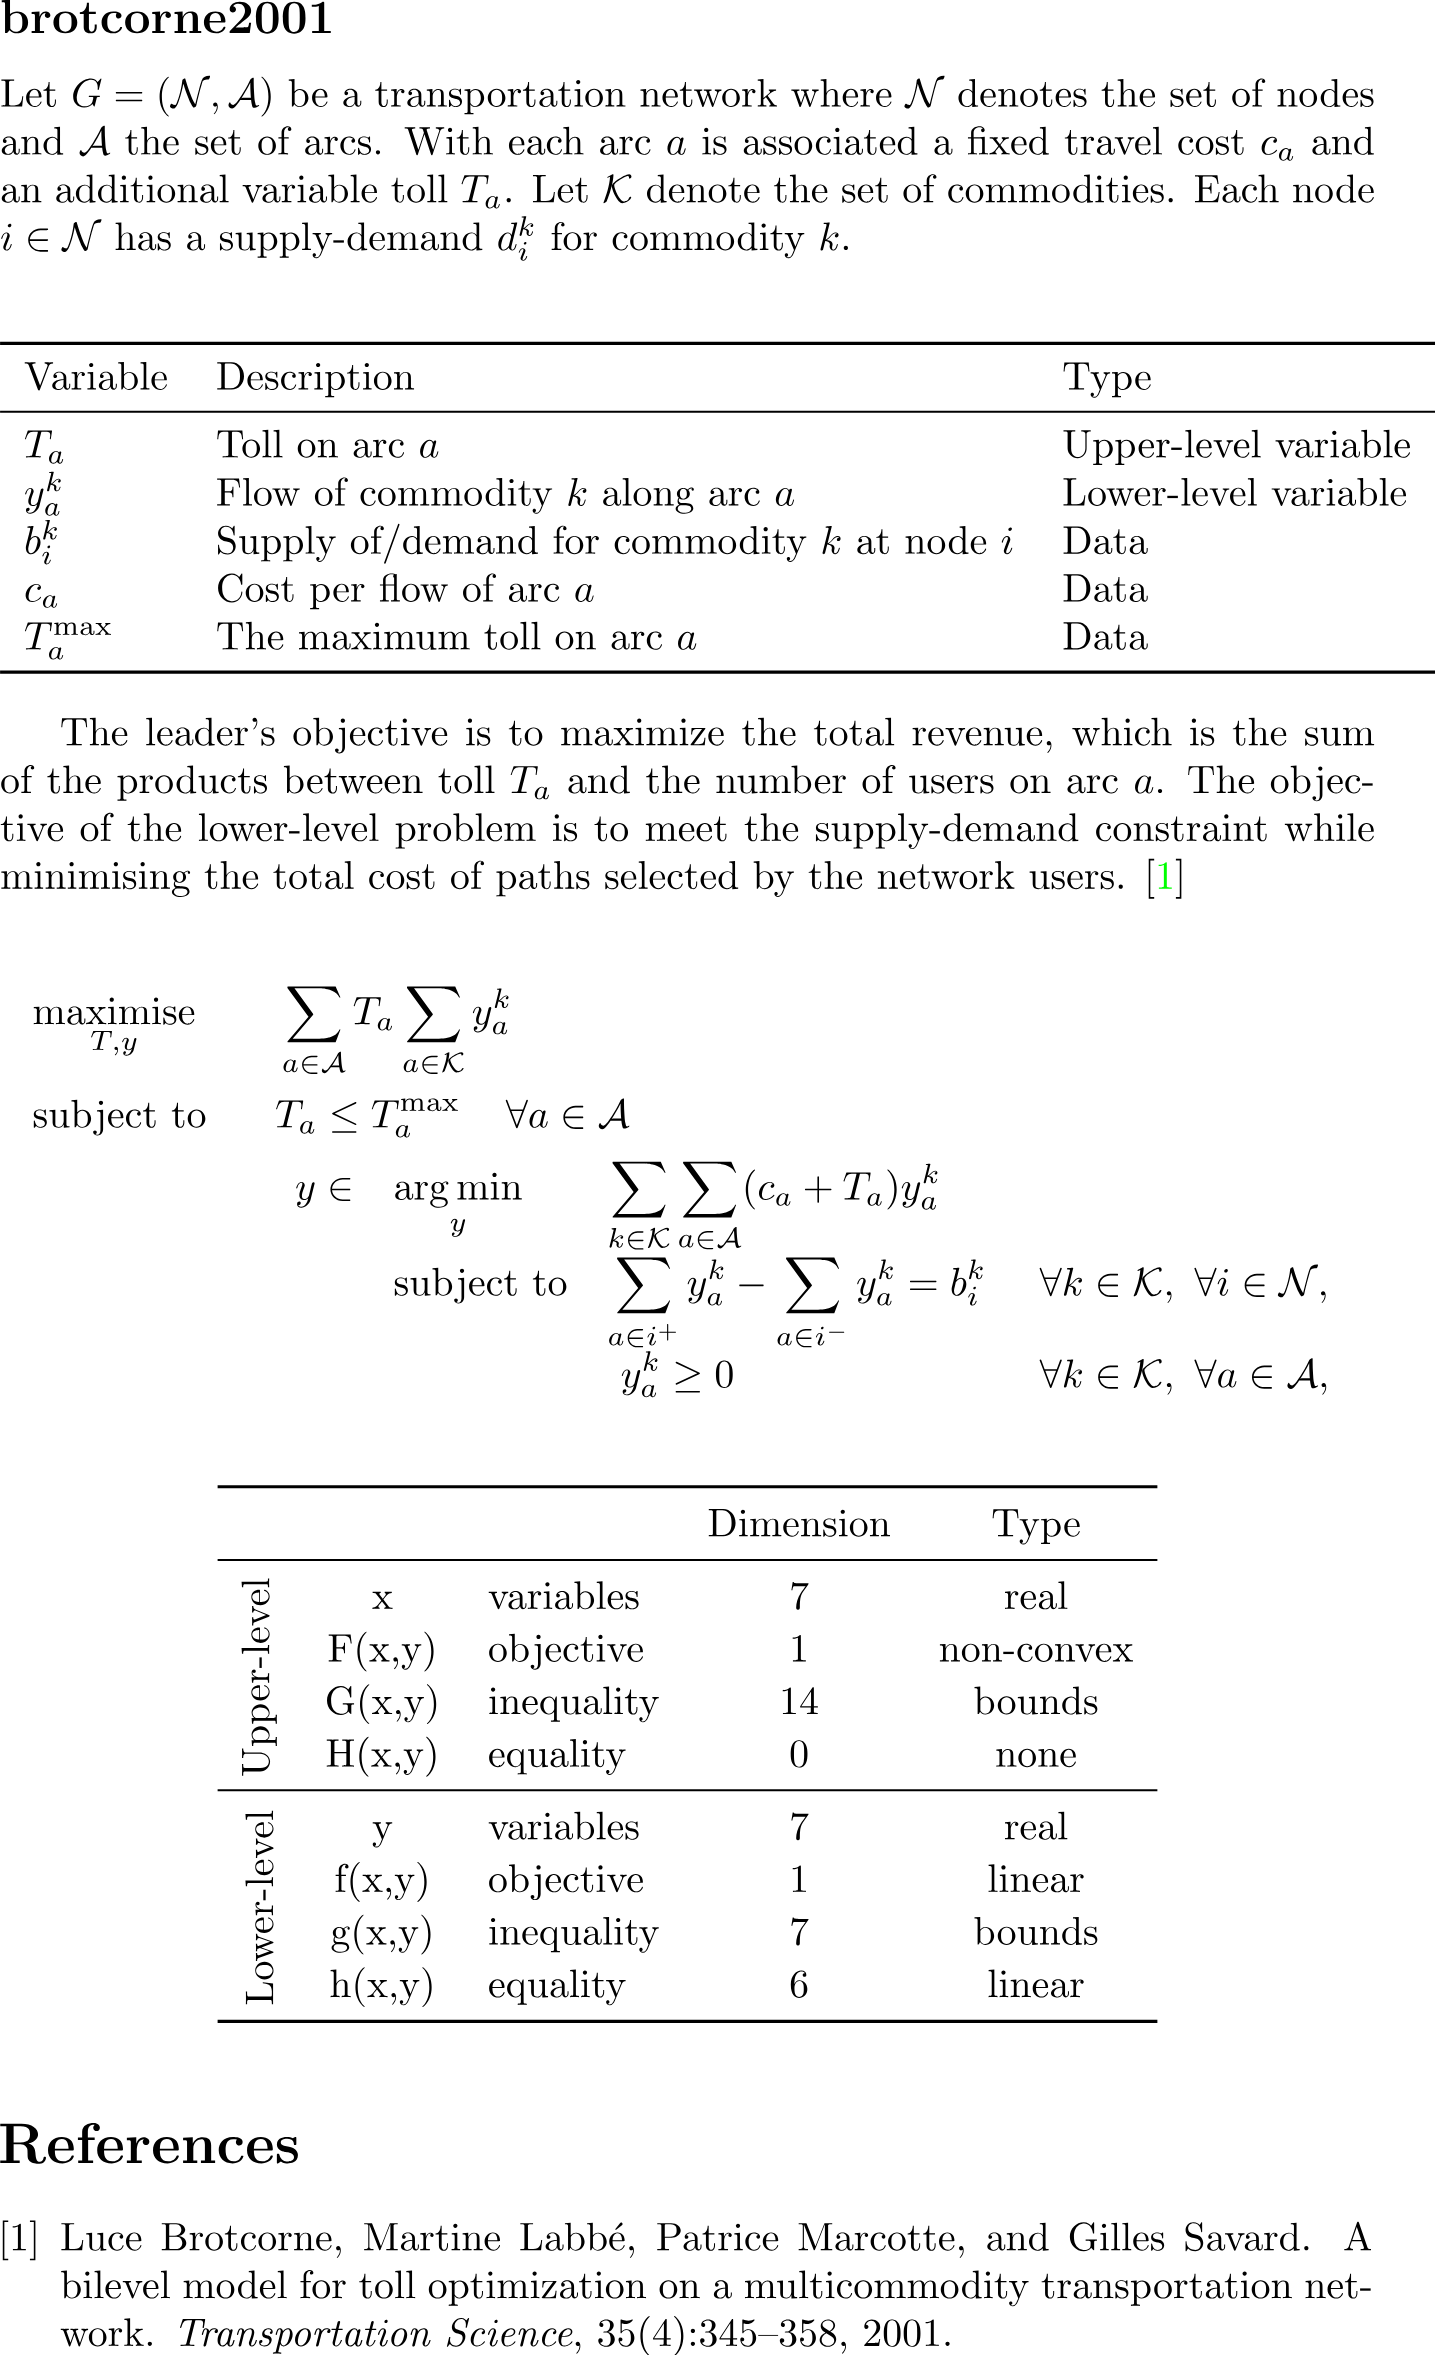
Let $G=\left(\mathcal{N},\mathcal{A}\right)$ be a transportation network where $\mathcal{N}$ denotes the set of nodes and $\mathcal{A}$ the set of arcs.
With each arc $a$ is associated a fixed travel cost $c_a$ and an additional variable toll $T_a$.
Let $\mathcal{K}$ denote the set of commodities.
Each node $i\in \mathcal{N}$ has a supply-demand $d^k_i$ for commodity $k$.
\begin{center}
\begin{tabular}{lll}
\toprule
Variable & Description & Type \\
\midrule
$T_a$ & Toll on arc $a$ & Upper-level variable \\
$y^k_{a}$ & Flow of commodity $k$ along arc $a$ & Lower-level variable \\
$b^k_i$ & Supply of/demand for commodity $k$ at node $i$ & Data \\
$c_{a}$ & Cost per flow of arc $a$ & Data \\
$T_a^{\max{}}$ & The maximum toll on arc $a$ & Data \\
\bottomrule
\end{tabular}
\end{center}
The leader’s objective is to maximize the total revenue, which is the sum of the products between toll $T_a$ and the number of users on arc $a$.
The objective of the lower-level problem is to meet the supply-demand constraint while minimising the total cost of paths selected by the network users. \cite{Brotcorne2001}
% Equation: brotcorne2001
\begin{align*}
&\maximise_{T, y} \quad && \sum_{a\in \mathcal{A}} T_a \sum_{a\in \mathcal{K}} y_a^k \\
&\subjectto && T_a \leq T_a^{\max{}} \quad \forall a \in \mathcal{A} \\
& &&
\begin{array}{*4{>{\displaystyle}l}}
y\in & \argmin_{y}\
&\sum_{k\in\mathcal{K}}\sum_{a\in\mathcal{A}}(c_a + T_a)y^k_a \\
&\subjectto\
& \sum_{a\in i^+}y^k_a - \sum_{a\in i^-}y^k_a = b^k_i
& \ \forall k \in \mathcal{K}, \ \forall i \in \mathcal{N},\\
&&\ y^k_a\geq 0
& \ \forall k\in\mathcal{K}, \ \forall a \in \mathcal{A},
\end{array}
\end{align*}classdef brotcorne2001
%{
A bilevel model for toll optimization on a multicommodity transportation network.
Luce Brotcorne, Martine Labbe, Patrice Marcotte, and Gilles Savard.
Transportation Science, 35(4):345–358, 2001.
%}
properties(Constant)
name = 'brotcorne2001';
category = 'transportation';
subcategory = '';
datasets = {
'network_brotcorne_fig1.csv';
'network_highway.csv';
'network_tryangle345.csv';
};
paths = fullfile('bolib3', 'data', 'network', brotcorne2001.datasets);
x0 = [0.0; 0.0; 0.0; 0.0; 5.0; 0.0; -2.0];
y0 = [0.0; 1.0; 0.0; 1.0; 2.0; 1.0; 1.0];
end
methods(Static)
% Upper-level objective function (nonconvex)
function val = F(x, y, data)
y2d = reshape(y, [data.num_arcs, data.num_commodities]);
val = -dot(x, sum(y2d, 2));
end
% Upper-level inequality constraints
function val = G(x, ~, data)
val = [
data.max_toll - x(:);
data.max_toll + x(:)
];
end
% Upper-level equality constraints
function val = H(~, ~, ~)
val = [];
end
% Lower-level objective function
function val = f(x, y, data)
y2d = reshape(y, [data.num_arcs, data.num_commodities]);
val = dot((data.cost + x(:)), sum(y2d, 2));
end
% Lower-level inequality constraints
function val = g(~, y, ~)
val = y;
end
% Lower-level equality constraints
function val = h(~, y, data)
y2d = reshape(y, [data.num_arcs, data.num_commodities]);
val = ((data.outflow * y2d) - (data.inflow * y2d) - data.supply_demand);
val = reshape(val, [], 1);
end
function data = read_data(filepath)
% Read the entire file
file = fopen(filepath, 'r');
content = fread(file, '*char')';
fclose(file);
% Split content into node and arc parts at blank line
parts = regexp(strtrim(content), '\n\s*\n', 'split');
if length(parts) ~= 2
error('File format incorrect: expected two tables separated by a blank line.');
end
node_part = parts{1};
arc_part = parts{2};
% Write each part to temporary files to read as tables
tmp_node = [tempname, '_nodes.csv'];
tmp_arc = [tempname, '_arcs.csv'];
fid = fopen(tmp_node, 'w'); fprintf(fid, '%s', node_part); fclose(fid);
fid = fopen(tmp_arc, 'w'); fprintf(fid, '%s', arc_part); fclose(fid);
% Read the tables
df_nodes = readtable(tmp_node);
df_arcs = readtable(tmp_arc);
% Delete temporary files
delete(tmp_node);
delete(tmp_arc);
% Check expected columns
if ~ismember('node', df_nodes.Properties.VariableNames)
error('Node column is missing from %s.', filepath);
end
required_arc_cols = {'arc', 'from', 'to', 'cost', 'max_toll'};
if ~all(ismember(required_arc_cols, df_arcs.Properties.VariableNames))
error('One or more of the required columns are missing from %s.', filepath);
end
% Dimensions
num_commodities = width(df_nodes) - 1;
num_nodes = height(df_nodes);
num_arcs = height(df_arcs);
% Mapping from node names to indices
% It is important we consider all node names as strings even if
% they're numerical!
node_names = string(df_nodes.node);
node_to_index = containers.Map(node_names, 1:num_nodes);
inflow = zeros(num_nodes, num_arcs);
outflow = zeros(num_nodes, num_arcs);
for arc_idx = 1:num_arcs
i = node_to_index(string(df_arcs.from(arc_idx)));
j = node_to_index(string(df_arcs.to(arc_idx)));
outflow(i, arc_idx) = 1;
inflow(j, arc_idx) = 1;
end
data = struct();
data.num_commodities = num_commodities;
data.num_nodes = num_nodes;
data.num_arcs = num_arcs;
data.inflow = inflow;
data.outflow = outflow;
data.cost = df_arcs.cost;
data.max_toll = df_arcs.max_toll;
data.supply_demand = table2array(df_nodes(:, 2:end));
end
% Key are the function/variable names
% Values are their dimension
function n = dimension(key, data)
n = dictionary( ...
'x', data.num_arcs, ...
'y', data.num_arcs * data.num_commodities, ...
'F', 1, ...
'G', data.num_arcs * 2, ...
'H', 0, ...
'f', 1, ...
'g', data.num_arcs * data.num_commodities, ...
'h', data.num_nodes * data.num_commodities ...
);
if isKey(n,key)
n = n(key);
end
end
end
endimport os.path
import pandas as pd
from numpy.typing import NDArray
from io import StringIO
from bolib3 import np
"""
A bilevel model for toll optimization on a multicommodity transportation network.
Luce Brotcorne, Martine Labbe, Patrice Marcotte, and Gilles Savard.
Transportation Science, 35(4):345–358, 2001.
"""
# Properties
name: str = "brotcorne2001"
category: str = "transportation"
subcategory: str = ""
datasets: list = [
'network_brotcorne_fig1.csv',
'network_highway.csv',
'network_tryangle345.csv',
]
paths: list = [
os.path.join('bolib3', 'data', 'network', 'network_brotcorne_fig1.csv'),
os.path.join('bolib3', 'data', 'network', 'network_highway.csv'),
os.path.join('bolib3', 'data', 'network', 'network_tryangle345.csv'),
]
# Methods
def F(x, y, data):
"""
Upper-level objective function
(nonconvex)
"""
num_commodities: int = data['num_commodities']
num_arcs: int = data['num_arcs']
y2d = np.reshape(y, (num_commodities, num_arcs))
return -np.sum(x*y2d)
def G(x, y, data):
"""
Upper-level inequality constraints
(bounds)
"""
max_toll: NDArray = data['max_toll']
return np.hstack([
max_toll - x,
max_toll + x
])
def H(x, y, data):
"""
Upper-level equality constraints
(none)
"""
return np.empty(0)
def f(x, y, data):
"""
Lower-level objective function
(linear)
"""
cost: NDArray = data['cost']
num_commodities: int = data['num_commodities']
num_arcs: int = data['num_arcs']
y2d = np.transpose(np.reshape(y, (num_commodities, num_arcs)))
return np.sum(np.dot((cost + x), y2d))
def g(x, y, data):
"""
Lower-level inequality constraints
(bounds)
"""
return y
def h(x, y, data):
"""
Lower-level equality constraints
"""
num_commodities: int = data['num_commodities']
num_nodes: int = data['num_nodes']
num_arcs: int = data['num_arcs']
inflow: NDArray = data['inflow']
outflow: NDArray = data['outflow']
supply_demand: NDArray = data['supply_demand']
y2d = np.transpose(np.reshape(y, (num_commodities, num_arcs)))
return (np.matmul(outflow, y2d) - np.matmul(inflow, y2d) - supply_demand).flatten()
def read_data(filepath=datasets[0]):
"""
Data files should be comma separated in the following format:
node, commodity_1[, commodity_2][, commodity_3]...
***, ***[, ***][, ***]
***, ***[, ***][, ***]
..., ...[, ...][, ...]
arc, from, to, cost, max_toll
***, ***, ***, ***, ***
***, ***, ***, ***, ***
..., ..., ..., ..., ...
"""
with open(filepath, 'r') as f:
content = f.read()
# Split at the blank line (two newlines in a row)
node_part, arc_part = content.strip().split('\n\n')
# Read each part using pandas and StringIO
df_nodes = pd.read_csv(StringIO(node_part), skipinitialspace=True)
df_arcs = pd.read_csv(StringIO(arc_part), skipinitialspace=True)
# Verify the column headers
if (not {'node'}.issubset(df_nodes.columns) or
not {'arc', 'from', 'to', 'cost', 'max_toll'}.issubset(df_arcs.columns)):
raise ValueError("Tables do not contain the expected columns.")
# dimension of the data
num_commodities = len(df_nodes.columns) - 1
num_nodes = len(df_nodes)
num_arcs = len(df_arcs)
# Create a mapping from node name to index
node_to_index = {node_name: idx for idx, node_name in enumerate(df_nodes['node'])}
# Create inflow and outflow matrices
inflow = np.zeros((num_nodes, num_arcs))
outflow = np.zeros((num_nodes, num_arcs))
for arc_idx, arc in df_arcs.iterrows():
i = node_to_index[arc['from']]
j = node_to_index[arc['to']]
outflow[i, arc_idx] = 1
inflow[j, arc_idx] = 1
return {
'num_commodities': num_commodities,
'num_nodes': num_nodes,
'num_arcs': num_arcs,
'inflow': inflow,
'outflow': outflow,
'cost': df_arcs['cost'].to_numpy(),
'max_toll': df_arcs['max_toll'].to_numpy(),
'supply_demand': df_nodes.iloc[:, 1:].to_numpy()
}
def dimension(key='', data=None):
"""
If the argument 'key' is not specified, then:
- a dictionary mapping variable/function names (str) to the corresponding dimension (int) is returned.
If the first argument 'key' is specified, then:
- a single integer representing the dimension of the variable/function with the name {key} is returned.
"""
num_commodities: int = data['num_commodities']
num_nodes: int = data['num_nodes']
num_arcs: int = data['num_arcs']
n = {
"x": num_arcs,
"y": num_arcs*num_commodities,
"F": 1,
"G": num_arcs*2,
"H": 0,
"f": 1,
"g": num_arcs*num_commodities,
"h": num_nodes*num_commodities,
}
if key in n:
return n[key]
return n